OS: FreeBSD 13
Shell: csh
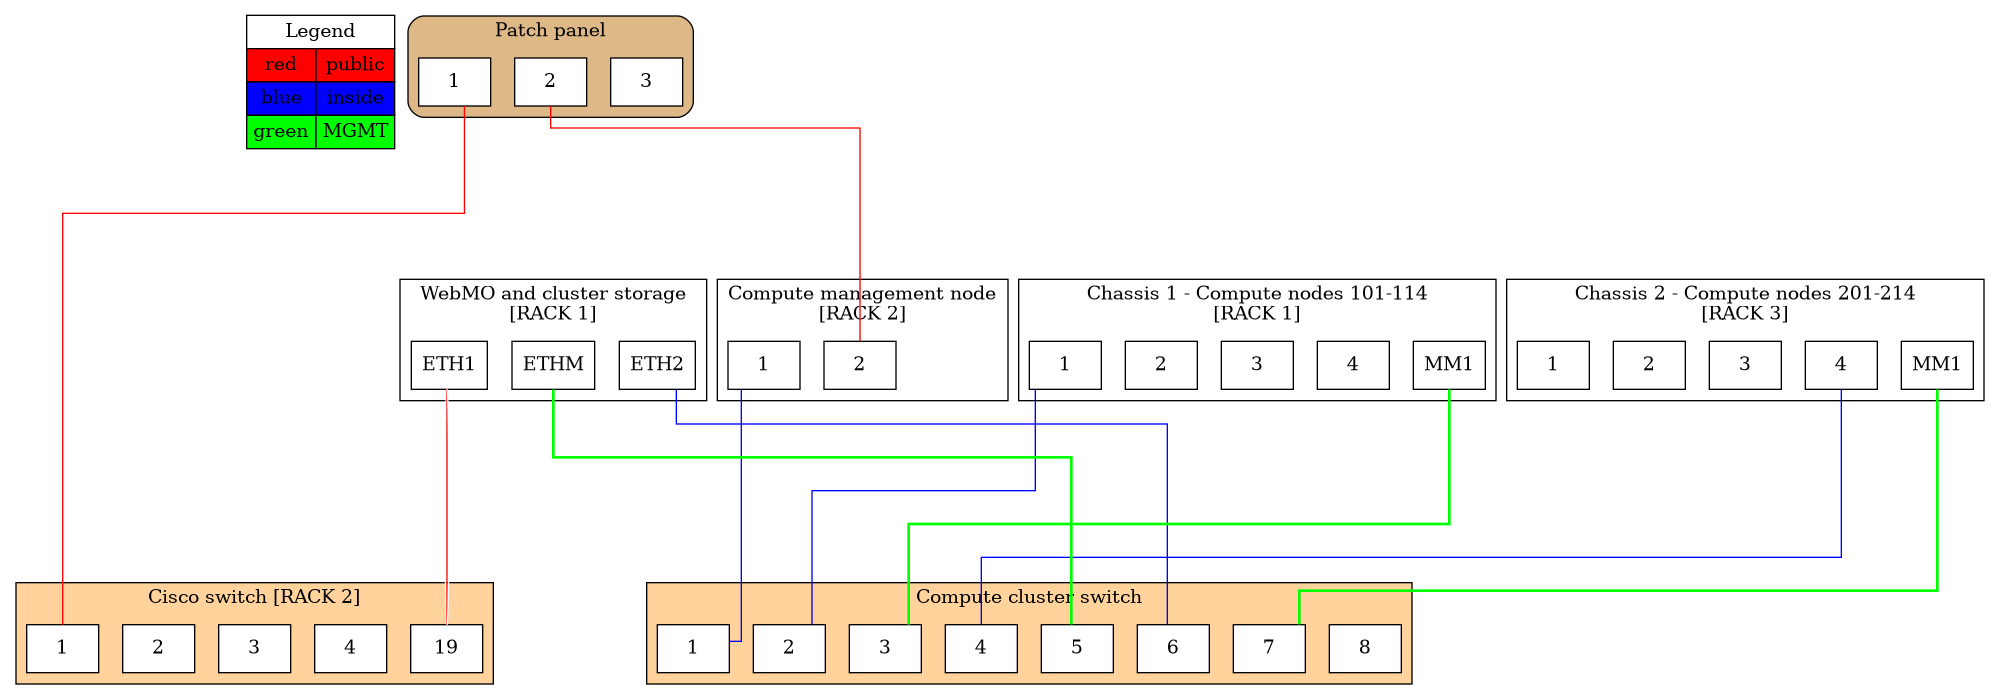
% cat wiring.dot
graph wiring {

  splines=ortho;
  ranksep="2.0 equally";

  legend [shape=none, margin=0, label=
  <
    <table border="0" cellborder="1" cellspacing="0" cellpadding="4">
        <tr><td colspan="2">Legend</td></tr>
        <tr><td bgcolor="red">red</td><td bgcolor="red">public</td></tr>
        <tr><td bgcolor="blue">blue</td><td bgcolor="blue">inside</td></tr>
        <tr><td bgcolor="green">green</td><td bgcolor="green">MGMT</td></tr>
    </table>
  >];

  subgraph cluster_pp {
    label="Patch panel";
    graph [fillcolor="burlywood", style="filled, rounded"];
    node [shape="record", fillcolor="white", style="filled"];
    edge [style="invis"];

    node [label="1"] p1;
    node [label="2"] p2;
    node [label="3"] p3;

    {rank="same"; p1; p2; p3;}
    p1 -- p2 -- p3;
  }

  subgraph cluster_webmo {
    label="WebMO and cluster storage\n[RACK 1]";
    edge [style="invis"];
    node [shape="record"];

    node [label="ETH1"] webmo1;
    node [label="ETH2"] webmo2;
    node [label="ETHM"] webmom;

    {rank="same"; webmo1; webmo2; webmom;}
    webmo1 -- webmo2 -- webmom;
  }

  subgraph cluster_achassis1 {
    label="Chassis 1 - Compute nodes 101-114\n[RACK 1]";
    edge [style="invis"];
    node [shape="record"];

    node [label="MM1"] ac1mm ;
    node [label="4"] ac1p4;
    node [label="3"] ac1p3;
    node [label="2"] ac1p2;
    node [label="1"] ac1p1;

    {rank="same"; ac1p1; ac1p2; ac1p3; ac1p4; ac1mm;}
    ac1p1 -- ac1p2 -- ac1p3 -- ac1p4 -- ac1mm;
  }

  subgraph cluster_achassis2 {
    label="Chassis 2 - Compute nodes 201-214\n[RACK 3]";
    edge[style="invis"];
    node [shape="record"];

    node [label="MM1"] ac2mm;
    node [label="1"] ac2p1;
    node [label="2"] ac2p2;
    node [label="3"] ac2p3;
    node [label="4"] ac2p4;

    {rank="same"; ac2p1; ac2p2; ac2p3; ac2p4; ac2mm}
    ac2p1 -- ac2p2 -- ac2p3 -- ac2p4 -- ac2mm;
  }

  subgraph cluster_compute_mgmt_node {
    label="Compute management node\n[RACK 2]";
    edge [style="invis"];
    node [shape="record"];

    node [label="2"] x2 ;
    node [label="1"] x1 ;

    {rank="same"; x1; x2;}
    x1 -- x2;
  }

  subgraph cluster_as {
    label="Compute cluster switch";
    graph [fillcolor="burlywood1", style="filled"];
    node [shape="record", fillcolor="white", style="filled"];
    edge [style="invis"];

    node [label="1"] asw1;
    node [label="2"] asw2;
    node [label="3"] asw3;
    node [label="4"] asw4;
    node [label="5"] asw5;
    node [label="6"] asw6;
    node [label="7"] asw7;
    node [label="8"] asw8;

    {rank="same"; asw1; asw2; asw3; asw4; asw5; asw6; asw7; asw8;}
    asw1 -- asw2 -- asw3 -- asw4 -- asw5 -- asw6 -- asw7 -- asw8;
  }

  subgraph cluster_cs {
    label="Cisco switch [RACK 2]";
    graph [fillcolor="burlywood1", style="filled"];
    node [shape="record", fillcolor="white", style="filled"];
    edge [style="invis"];

    node [label="1"] cs1;
    node [label="2"] cs2;
    node [label="3"] cs3;
    node [label="4"] cs4;
    node [label="19"] cs19;

    {rank="same"; cs1; cs2; cs3; cs4; cs19;}
    cs1 -- cs2 -- cs3 -- cs4 -- cs19;
  }

  align_chassis [style="invis"];
  align_chassis -- ac1mm [style="invis"];
  align_chassis -- ac2mm [style="invis"];

  x1 -- asw1 [color="blue"];
  p2 -- x2 [color="red"];
  p1:sw -- cs1 [color="red"];
  asw3 -- ac1mm [color="green", penwidth=2, constraint="false"];
  asw5 -- webmom [color="green", penwidth=2];
  asw7 -- ac2mm [color="green", penwidth=2, constraint="false"];
  webmo1:sw -- cs19:ne [color="white:red:white"];
  webmo2-- asw6 [color="blue"];
  ac1p1 -- asw2 [color="blue"];
  asw4 -- ac2p4 [color="blue", constraint="false"];
}
To generate the diagram with Graphviz:
% dot -Tpng graph.dot -o graph.png
To generate the diagram with PlantUML via a self-managed instance of Kroki (How to Run Kroki on FreeBSD 13 with Java or How to Run Kroki on FreeBSD 13 with vm-bhyve and Debian GNU/Linux VM):
% cat \
 wiring.dot | \
 http \
 http://localhost:8000/plantuml/png \
 Content-Type:text/plain > \
 wiring.png
% xv wiring.png

- WebMO server and cluster storage: 1U (1 rack unit) Lenovo server
- 3 Ethernet ports (2 Ethernet ports and an Ethernet Management Port)
- Compute management node: 1U (1 rack unit) IBM server
- 2 Ethernet ports
- Chassis 1 wtth compute nodes 101-114: IBM blade server with 14 blades
- Module with 4 Ethernet ports
- Management module with KVM (keyboard, video, monitor) and an Ethernet Managemet Port
- Chassis 2 with compute nodes 201-214: IBM blade server with 14 blades
- Module with 4 Ethernet ports
- Management module with KVM (keyboard, video, monitor) and an Ethernet Managemet Port
NOTE:
For testing layouts, you can use your own instance of the Graphviz Visual Editor How To Install Graphviz Visual Editor on FreeBSD in a Linux Guest in Bhyve or if you prefer use it online provided by its author Graphviz Visual Editor - Magnus Jacobsson.
References:
How do I style the ports of record based nodes in GraphViz?
(Retrieved on Mar 4, 2022)How to force position of edges in graphviz?
(Retrieved on Mar 4, 2022)Drawing graphs with dot
(Retrieved on Mar 4, 2022)Physical network diagram generated from dot config language
(Posted on Dec30, 2013)
(Retrieved on Mar 4, 2022)WebMO - a web-based interface to computational chemistry packages