OS: FreeBSD 13
Shell: csh
Python version: 3.8.12
Kroki provides an HTTP API to create diagrams from textual descriptions. It handles both GET and POST requests. When using GET requests, your diagram must be encoded in the URI (URL) using a deflate + base64 algorithm.
If you don’t want to use deflate and base64, you can also send your diagram as plain text using POST requests.
NOTE:
In the following examples, I use the HTTPie command line HTTP client and curl command line tool and library for executing GET and POST requests.
Colours
Send the Data from a File in a POST Request with PNG as the Output Format
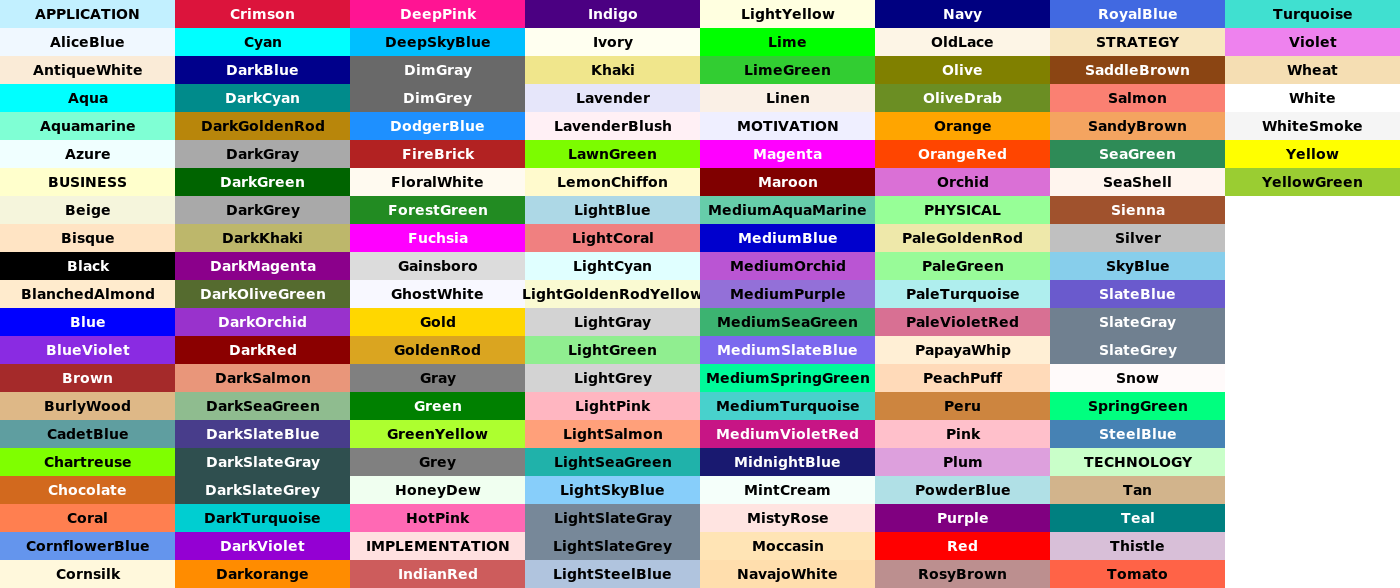
Print all all named colours suggested by PlantUML using a special diagram description:
% cat colors_plantuml.txt
@startuml
colors
@enduml
% cat \
 colors_plantuml.txt | \
 http \
 http://localhost:8000/plantuml/png \
 Content-Type:text/plain > \
 colors_plantuml.png
% xv colors_plantuml.png
References:
Choosing colors - PlantUML
qywx / PlantUML-colors
Kroki - Diagram types and output formats
Gantt Chart
Send Data from a File in a POST Request with SVG as the Output Format
Based on Drawing diagrams with PlantUML
(Linux Magazine article from June 2020 Issue 235/2020)
(Retrieved on Mar 2, 2022)
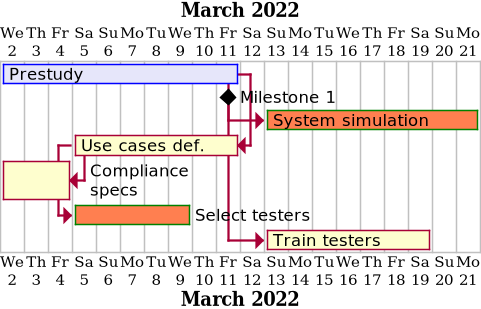
% cat gantt_plantuml.txt
@startgantt
' Based on https://www.linux-magazine.com/Issues/2020/235/PlantUML-Diagrams
scale 1.5
Project starts 2022/03/02
[Prestudy] lasts 10 days and is colored in Lavender/Blue
[Milestone 1] happens at [Prestudy]'s end
[System simulation] lasts 9 days and is colored in Coral/Green and starts 1 day after [Prestudy]'s end
[Use cases def.] lasts 7 days and ends at [Prestudy]'s end
[Compliance\nspecs] lasts 3 days and ends at [Use cases def.]'s start
[Select testers] is colored in Coral/Green
[Select testers] lasts 5 days and starts at [Use cases def.]'s start
[Train testers] starts 1 days after [Milestone 1]'s end and lasts 7 days
@endgantt
% cat \
 gantt_plantuml.txt | \
 http \
 http://localhost:8000/plantuml/png \
 Content-Type:text/plain > \
 gantt_plantuml.png
% xv gantt_plantuml.png
Mind Map
Output from GET - Encoded in the URI (URL) using a deflate + base64 algorithm
Based on PlantUML-Examples repo
(Retrieved on Mar 2, 2022)
and
Diagrams as Code (PlantUML)
(Retrieved on Mar 2, 2022)
% cat mindmap_plantuml.txt
@startuml
' Based on https://github.com/mattjhayes/PlantUML-Examples/blob/master/docs/Misc/BlogSource/Other-Uses-for-PlantUML/tasks-diagram.md
' https://mattjhayes.com/2019/08/17/diagrams-as-code-plantuml/
```plantuml
@startmindmap
skinparam ArrowColor DarkGrey
<style>
mindmapDiagram {
  node {
    Padding 15
    Margin 15
    BackGroundColor YellowGreen
    FontColor DarkSlateGrey
    LineColor White
    LineThickness 1.0
    MaximumWidth 320
  }
  rootNode {
    Padding 15
    Margin 15
    BackGroundColor YellowGreen
    FontColor DarkSlateGrey
    FontSize 18
    LineColor White
    LineThickness 1.0
  }
  leafNode {
    Padding 15
    Margin 15
    BackGroundColor LightGray
    FontColor DarkSlateGrey
    FontSize 15
    LineColor ForestGreen
    LineThickness 2.0
  }
  ' Styles to apply to tasks based on status:
  ' in progress (i)
  .i {
    BackgroundColor SkyBlue
  }
  ' completed (c)
  .c {
    BackgroundColor LightSlateGray
    FontStyle italic
    FontColor DarkGray
  }
  ' urgent (u)
  .u {
    BackgroundColor OrangeRed
    FontStyle bold
  }
  ' delegated (d)
  .d {
    BackgroundColor Gold
  }
}
</style>
' Legend colours need to be updated manually :-(
legend
|<back:LightGray><b>Not Started.</b></back>|
|<back:SkyBlue><b>In Progress.</b></back>|
|<back:LightSlateGrey><i>Completed     .</i></back>|
|<back:OrangeRed><b>Urgent        .</b></back>|
|<back:Gold><b>Delegated   .</b></back>|
|<back:YellowGreen><b>Branch        .</b></back>|
endlegend

* Current Tasks

 * Schedule Project Meeting <<u>>
  * Review RFP document <<i>>
  * Create meeting agenda <<i>>
  * Attend RFP workshop with customer

 * Website Architecture
  * Write Draft Architecture Document <<i>>
  * Discuss with Customer and get feedback <<u>>
  * Update based on Feedback

 * Staging Environment Build
  * Q/A High-Level Design <<i>>
  * Design for Legacy Connection (Team 1) <<d>>
  * Design for Portal (Team 2) <<d>>

@endmindmap
@enduml
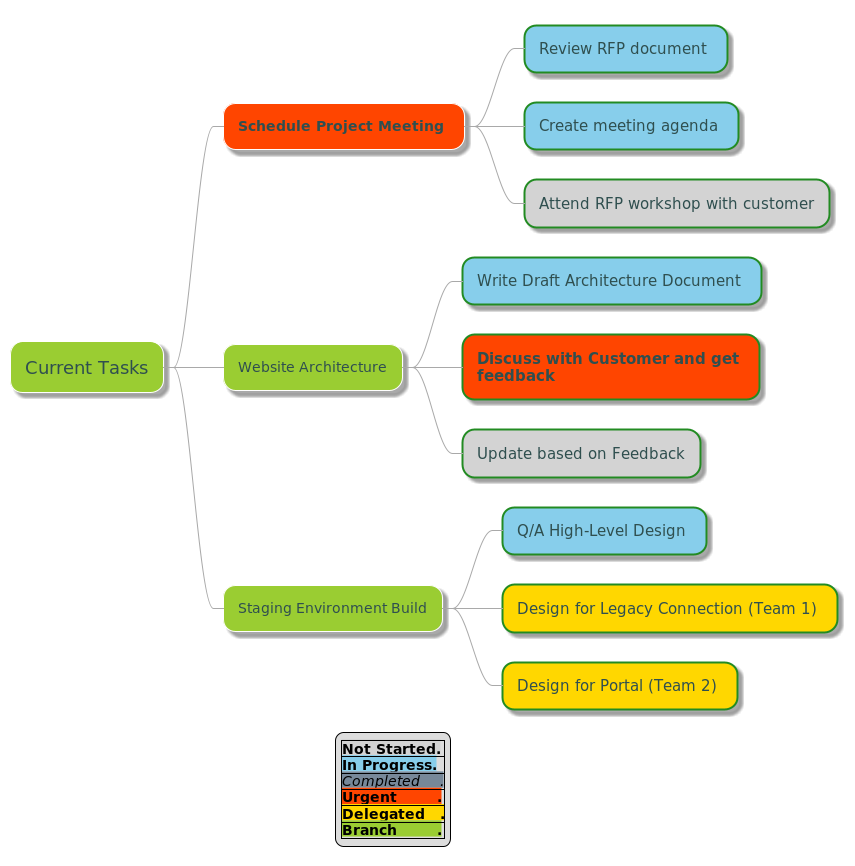
Send a POST request using HTTPie, HTTP Clients - Kroki documentation to generate the mind map image.
% http \
 http://localhost:8000/ \
 diagram_type='plantuml' \
 output_format='png' \
 diagram_source='@mindmap_plantuml.txt' \
 > mindmap_plantuml.png
% xv mindmap_plantuml.png
Alternatively, you can display the image in a web browser.
% command -v python

% command -v python3

% command -v python3.8
/usr/local/bin/python3.8

% ls -lh /usr/local/bin/python*
-r-xr-xr-x  1 root  wheel   5.1K Feb  2 17:12 /usr/local/bin/python3.8
-r-xr-xr-x  1 root  wheel   3.1K Feb  2 17:12 /usr/local/bin/python3.8-config
lrwxr-xr-x  1 root  wheel    50B Feb 12 17:41 /usr/local/bin/pythontex -> ../share/texmf-dist/scripts/pythontex/pythontex.py
% python3.8 --version
Python 3.8.12
Using a Python to encode your diagram using deflate + base64:
% cat \
 mindmap_plantuml.txt | \
 python3.8 -c \
 "import sys; import base64; import zlib; \
 print(base64.urlsafe_b64encode(zlib.\
 compress(sys.stdin.read().encode('utf-8'), 9)).decode('ascii'))"
The above command returns a value:
eNq9VU1v2zgQvetXzC1uAFlxFsW2gWEktpvsAk7rjRMEewsljiXWFCnwI47b5r93SEuO0ySH7mEFCJDIx_feDGfIU-uYcb6WyQGMmUUOWkHlXGNPsqwUrvJ5v9B1VjPnvlZsgzabS6bczeUs_fTA6kbSSC51Tgjr0GRcFza7FLbIxlKXC-1NgdkXV6FJbyzadKlN2jFkjtmVTblgpWF1v-ZkotN-Eoz6x0eDj9nRh2zwZ9bCbcpsWmiOaRPoKIQsubu7636S0xhZLRSvWZPYlVANo2VwZoxeT7TUBqbMrC4MbpKhdRuJo6RFT7cK8D0BUKQQPwDmjHOhShi8j7-XzJRCdX9jVhCX9opvuf9FKfWa2FHF-XOt3JPqQjKHUTrMzYTC7dxtJRzuxq4rUawUWguD_lGr-SBqX98K7ir44zgMPtJrtHaf_wejYW4hviEMPvyW8eBRIlv-V48zUVbuwrDNbzh8_4vDc23Quqc4n_s83vk8gEUoBgtOA2sauQkfsVAh7xqESst5exLR5LoxujSBpSfe0VhftDGGMMq9MBarzVh63AlRYVP_OOLsFXFh8cbCGH8b6F4SolEQjklRvJKZFrvV8qZE5aDno5B_Q-iLYarEK-S_aORa8h0VR4kli7Z5ZONvsF10qx6TYda22AHMkJxwCl7S4WBBIRFRinME3_BIWzPlmaTMn6S9REZ48mOYE_vJrhJGw3z0WTvaLOpy5P1hlo_oJczoRwdu8x2gfyuYt7v0KnQ_w0jkYjTZbU54aJF4sWiXraBws01w-7wqEvIRoNNdAt8A7vVkwI9Jp6hep6bctBlKDmHijQkmrkO5JgkcwqKokHvaQYr-KxYOLhFd6Lvh0I9GtDmHcIX3AtdwdT4HOrx9HQiGlIDt7MQgOYW6XcaCFNubP3Mu7GZYvdZmZSvdwJruDSi8dbpGE23cYm7pgKDDtwgHReG8wbj81oThqWFL92wSpi-tTOlW8dRlkX7S0gMj9RIdLKmOQk72IruJ9fTUtuctZJsZx8oQ0Sd1L4xWUWvsRazYQ_gnO4O_qCbSGd6jhClaUap9L9uBZWhO2stiAxOtFHkXpNO7Rro9Bu8Iz1_i59pQx7ag4w6UnFIau9sqfIc77CfVVW5A
Copy and paste the output to your web browser:
http://localhost:8000/plantuml/svg/eNq9VU1v2zgQvetXzC1uAFlxFsW2gWEktpvsAk7rjRMEewsljiXWFCnwI47b5r93SEuO0ySH7mEFCJDIx_feDGfIU-uYcb6WyQGMmUUOWkHlXGNPsqwUrvJ5v9B1VjPnvlZsgzabS6bczeUs_fTA6kbSSC51Tgjr0GRcFza7FLbIxlKXC-1NgdkXV6FJbyzadKlN2jFkjtmVTblgpWF1v-ZkotN-Eoz6x0eDj9nRh2zwZ9bCbcpsWmiOaRPoKIQsubu7636S0xhZLRSvWZPYlVANo2VwZoxeT7TUBqbMrC4MbpKhdRuJo6RFT7cK8D0BUKQQPwDmjHOhShi8j7-XzJRCdX9jVhCX9opvuf9FKfWa2FHF-XOt3JPqQjKHUTrMzYTC7dxtJRzuxq4rUawUWguD_lGr-SBqX98K7ir44zgMPtJrtHaf_wejYW4hviEMPvyW8eBRIlv-V48zUVbuwrDNbzh8_4vDc23Quqc4n_s83vk8gEUoBgtOA2sauQkfsVAh7xqESst5exLR5LoxujSBpSfe0VhftDGGMMq9MBarzVh63AlRYVP_OOLsFXFh8cbCGH8b6F4SolEQjklRvJKZFrvV8qZE5aDno5B_Q-iLYarEK-S_aORa8h0VR4kli7Z5ZONvsF10qx6TYda22AHMkJxwCl7S4WBBIRFRinME3_BIWzPlmaTMn6S9REZ48mOYE_vJrhJGw3z0WTvaLOpy5P1hlo_oJczoRwdu8x2gfyuYt7v0KnQ_w0jkYjTZbU54aJF4sWiXraBws01w-7wqEvIRoNNdAt8A7vVkwI9Jp6hep6bctBlKDmHijQkmrkO5JgkcwqKokHvaQYr-KxYOLhFd6Lvh0I9GtDmHcIX3AtdwdT4HOrx9HQiGlIDt7MQgOYW6XcaCFNubP3Mu7GZYvdZmZSvdwJruDSi8dbpGE23cYm7pgKDDtwgHReG8wbj81oThqWFL92wSpi-tTOlW8dRlkX7S0gMj9RIdLKmOQk72IruJ9fTUtuctZJsZx8oQ0Sd1L4xWUWvsRazYQ_gnO4O_qCbSGd6jhClaUap9L9uBZWhO2stiAxOtFHkXpNO7Rro9Bu8Iz1_i59pQx7ag4w6UnFIau9sqfIc77CfVVW5A
Here’s the result:

POST Requests
When calling Kroki with POST method, you don’t need to encode your diagram.
POST Requests with HTTPie and with Data from a File
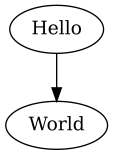
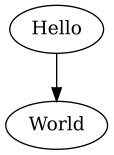
% cat hello.txt
{
  "diagram_source": "digraph G { Hello -> World }",
  "diagram_type": "graphviz",
  "output_format": "svg"
}
% http http://localhost:8000/ < hello.txt > hello.svg
% rsvg-convert hello.svg > hello.png
% xv hello.png
POST Requests with curl
% curl -d '{ \
 "diagram_source": "digraph G { Hello -> World }", \
 "diagram_type": "graphviz", \
 "output_format": "svg" \
 }' \
 -X POST http://localhost:8000/ \
 > hello.svg
% rsvg-convert hello.svg > hello.png
% xv hello.png
